 Going into November, the game isn’t over for 2016, but it’s certainly a good time to check the scoreboard … especially as you start planning for next year.
Your buddy, Eric, is here to help. I figured, as I’m beginning 2017 planning for my community bank and CU clients, I could share some of the industry data that I’ve collected. You can thank me (or buy me a beer) later!
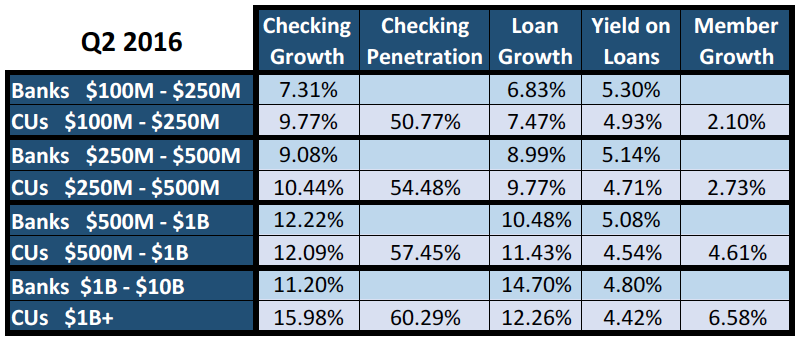
I’ve put together a quick chart on the Q2 national average in some key categories for banks and credit unions based on asset categories. How do you compare against your peers?
In fact, WHO are your peers? I have a credit union client who is above $330 million in assets with more than 38,000 members and we don’t pay too much attention to the “credit unions $250M – $500M” category. This CEO considers our “peers” as a billion dollars in assets or more – one local credit union and the regional banks.
So, what does this data tell us in the big picture?
- The rich keep getting richer: Customer/member growth, checking growth, checking penetration and loan growth all rise faster with bigger institutions. This can’t all be mergers.
- Smaller institutions have larger loan yield: Banks have higher yield than credit unions across the board. In fact, the yield from highest CU category nearly matches that of the lowest bank.
Some other trends:
- Checking Growth: Growth has been trending down since 2011, but still growing. There has been a spike, in most categories, in Q4 for ’14 and ’15. So much for the assumption that you can’t sell checking during the holidays!
- Banks have seen the sharpest drop in checking growth since Q4 2014. Particularly those $250M – $500M and $1B+
- Loan Growth: The trend is that growth has been increasing for everyone. Growth slowed across all asset categories starting in Q3 2014. The $1B+ credit unions have seen the slowest growth since Q2 2014 and the trend is in decline currently.
- Yield: Trending down since 2011. Essentially flat since Q1 2015 for everyone
- Delinquencies: Have fallen from 1.5% to under 1% for CUs and from 7%-8% to about 2.5% for banks since 2011. This is great news!!!
- Loans to Assets: Tending up since 2011 from around 60% to 65%. CUs $1B+ come in the highest (67.88%) and CUs $100M – $250M are lowest (61.29%)
- Real Estate Loans/Total Loans: Banks range from 75.58% ($100M – $250M) to 80.97% ($500-$1B). CUs range from 45.35% ($100M – $250M) to 53.37% ($1B+). It’s no surprise that banks own the real estate market share, but more and more credit unions are looking to take a bite from that pie.
- Auto Loan Growth: For credit unions, auto loan growth has slowed across the board since Q1 2015. Currently, average growth is between 10.87% ($100M – $250M) to 16.39% ($1B+)
Overall, things look pretty darn good, though there is a serious concern about the flattening of loan growth and the decline in yield.
I hope that this helps to give you a quick glance at where your institution sits and maybe a goal to focus on as you write that 2017 plan.
In addition to being a strategic consultant for community banks and credit unions, MarketMatch also has nationally and internationally requested speakers. Contact us to bring our marketing ideas to your institution or next conference.
See our story here. (click)
Or email me directly (click)
937-371-2461
Follow us on Twitter @MarketMatch


